
March 2020 caught us all off guard with the emerging threat of a silent enemy, COVID-19, the novel corona virus that will go down in history for its’ elusive disease progression and economic impact across the globe. Literally every country, city, and person has been impacted in some manner. Mid-Ohio Food Collective (MOFC) and its partner agencies are no exception. Food distribution models changed rapidly to implement safety protocols and keep people safe. One of the big unknowns at the start of the pandemic was the potential impact on food insecurity. When schools and businesses closed, it was clear that unemployment would rise and household income levels would be affected; which ultimately could increase food insecurity in our neighborhoods. Feeding America used projected changes to unemployment and poverty in their model to understand the projected changed to food insecurity resulting from Covid-19 (Feeding America, 2020). Based on their assumptions and projected analysis, 13.2 million additional people were projected to face food insecurity on a national level in 2020 when compared to 2018.
So how do we know what has been happening in our communities since the beginning of March 2020? Fortunately, data collected through FreshTrak can be used to provide trends for MOFC and its partner agencies.
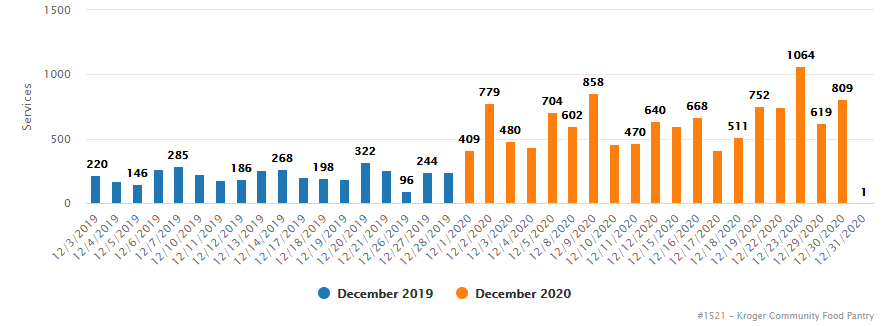
First, let’s look at FreshTrak data for the MOFC on-site Kroger Community Pantry. One way to evaluate the trends is to compare and analyze data collected before and during the pandemic. In 2019, 53,808 households were served by the MOFC on-site pantry. By the end of 2020, there was a two-fold increase in the number of households served with a total of 116,435 households served. While there has been a steady low level increase in the number of services at the on-site pantry over the past nine years, the service numbers more than doubled from 53,795 in 2019 to 115,707 in 2020. The average number of services per day increased from 213 to 435; there were even some daily highs of over 1000 families served. Figure 1 shows a comparison of daily service volumes in December 2019 to December 2020 at the on-site pantry.
Figure 1. Daily Services Visits at the MOFC On-Site Pantry
While it is clear there has been an increase in services and the number of families served at the MOFC on-site pantry, many factors can influence this trend. We know some of our partner agencies closed during the pandemic requiring customers to find other sources of food. In an effort to safely and efficiently serve our customers, a ‘drive-thru” model was established and other restrictions were lifted. Understanding how these factors impacted data trends is part of a much larger analytical challenge.
When we take a broader look at FreshTrak data, similar trends are observed. Across the 20 counties MOFC serves, 168,976 families were served in 2019 and 197,555 families were served in 2020, a 17% increase. When taking a closer look at similar timeframes both pre- and post-Covid, the increase in the number of new families served is notable with an increase of almost 30% from 2019 (Table 1). In Franklin County alone, the amount of food that was distributed increased from 1,424,637 lbs during December 2019 to 2,107,077 lbs during December 2020; with fewer agencies distributing food. That is quite a few additional meals! Based on Feeding America standards (1.2 lbs per meals); the estimated number of additional meals increased by 568,700 in December 2020.
Table 1. Data Comparison Pre- and Post-Covid
| March 1 through December 31 | 2019 | 2020 | Percent Increase | |||
| Franklin | 20 Counties | Franklin | 20 Counties | Franklin | 20 Counties | |
| New Families | 27,537 | 41,350 | 35,572 | 52,832 | 29 | 28 |
| All Families | 99,936 | 158,138 | 118,043 | 181,450 | 18 | 15 |
| Service Visits | 584,897 | 951,678 | 639,594 | 1,014,542 | 9.4 | 6.6 |
| Visits per Family | 5.85 | 6.02 | 5.42 | 5.59 | -7.4 | -7.1 |
What have we learned?
Data gaps exist.
The trend of an increased need for food is clear indicating food insecurity is on the upswing. Understanding the economic implications of the pandemic is vital to understanding its potential impact on food insecurity. As the pandemic continues to affect people across the country, collection and analysis of data are critical to identifying insights at a much deeper level, most notably on customer demographics and supply chains.
Growing numbers of people are facing food insecurity. The data shows the reality that more families are facing food insecurity since the onset of the pandemic. The number of new families in 2020 compared to 2019 is up by 28% across the 20 county footprint. Those are the families who are seeking some level of help. How many families are struggling to get enough food that are hesitant to get help?
What are the challenges ahead? There is an alarming need to identify insights on food insecurity. Our focus as a food bank and network will continue to be providing customers with access to nutritious food. To end hunger, we must understand the root causes of food insecurity so intervention is possible early in the cycle. For customers, better information about available resources, launch of new programs, easy access to programs, and clear requirements may be the first steps. For foodbanks, taking a much deeper look at data using advanced analytics to identify novel insights and develop predictive models with credible accuracy is critical as well as powering new advocacy initiatives for better public policy to address these crises holistically.
As economic instability continues in the midst of a growing population and devastating pandemic, will the need for food and the amount of food available to meet those needs be sustainable?